miércoles, 28 de febrero de 2018
martes, 27 de febrero de 2018
.
Regenerative agriculture: merging farming and natural resource conservation profitably
Claire E. LaCanne, Jonathan G. Lundgren
Most cropland in the United States is characterized by large monocultures, whose productivity is maintained through a strong reliance on costly tillage, external fertilizers, and pesticides (Schipanski et al., 2016). Despite this, farmers have developed a regenerative model of farm production that promotes soil health and biodiversity, while producing nutrient-dense farm products profitably. Little work has focused on the relative costs and benefits of novel regenerative farming operations, which necessitates studying in situ, farmer-defined best management practices. Here, we evaluate the relative effects of regenerative and conventional corn production systems on pest management services, soil conservation, and farmer profitability and productivity throughout the Northern Plains of the United States. Regenerative farming systems provided greater ecosystem services and profitability for farmers than an input-intensive model of corn production. Pests were 10-fold more abundant in insecticide-treated corn fields than on insecticide-free regenerative farms, indicating that farmers who proactively design pest-resilient food systems outperform farmers that react to pests chemically. Regenerative fields had 29% lower grain production but 78% higher profits over traditional corn production systems. Profit was positively correlated with the particulate organic matter of the soil, not yield. These results provide the basis for dialogue on ecologically based farming systems that could be used to simultaneously produce food while conserving our natural resource base: two factors that are pitted against one another in simplified food production systems. To attain this requires a systems-level shift on the farm; simply applying individual regenerative practices within the current production model will not likely produce the documented results.

Figure 1: Insecticide-treated cornfields had higher pest abundance than untreated, regenerative cornfields. Values presented are mean ± SEM total
pests (corn rootworm adults, European corn borers, Western bean cutworm,
other caterpillars, and aphids) per m2, and were assessed
during corn anthesis. The systems were regarded as best-management
practices for the sampled region by the farmers themselves. All
conventional farms planted neonicotinoid-treated, Bt corn seed to
prophylactically reduce pests, and some cornfields were also sprayed
with insecticides. Regenerative farms included >3 of the following
practices: use of a multispecies cover crop, abandonment of insecticide,
abandonment of tillage, and the cropland was grazed, etc. Pest
abundance was significantly different in the two systems (α = 0.05; n = 39 regenerative cornfields and 40 conventional cornfields).
.
.

lunes, 26 de febrero de 2018
sábado, 24 de febrero de 2018

lunes, 19 de febrero de 2018
"There seems to me too much misery in the world. I cannot persuade myself that a beneficent and omnipotent God would have designedly created the Ichneumonidæ with the express intention of their feeding within the living bodies of Caterpillar"
Charles Darwin

Photo:Alex Wild (http://www.alexanderwild.com)
Charles Darwin

Photo:Alex Wild (http://www.alexanderwild.com)
domingo, 18 de febrero de 2018
.
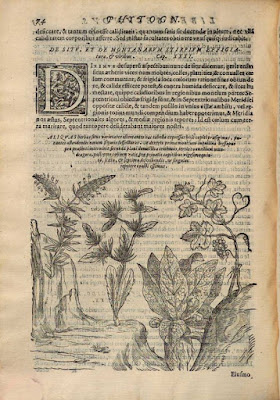
Phytognomonica (G.B. della Porta, Naples 1588)


http://digital.onb.ac.at/OnbViewer/viewer.faces?doc=ABO_%2BZ182656708
.
Phytognomonica (G.B. della Porta, Naples 1588)


http://digital.onb.ac.at/OnbViewer/viewer.faces?doc=ABO_%2BZ182656708
.

Managing and manipulating the rhizosphere microbiome for plant health: A systems approach
Matthew D.Wallenstein
Abstract

https://www.sciencedirect.com/science/article/pii/S2452219817300447
.
Matthew D.Wallenstein
Abstract
Plants co-evolved with microbes, and plant genotypes that supported microbiomes that increased their own health likely had a fitness advantage under natural selection. Plant domestication and crop breeding under fertilization have largely decoupled the rhizosphere microbiome from plant selection. If important interactions have been lost as a result, there is an exciting opportunity to re-engineer characteristics of beneficial rhizosphere microbiomes back into agricultural cropping systems. New tools will allow us to engineer the rhizosphere with increasing sophistication in the future, but must recognize that the rhizosphere is a highly connected and interactive system.

https://www.sciencedirect.com/science/article/pii/S2452219817300447
.


sábado, 17 de febrero de 2018

viernes, 16 de febrero de 2018

jueves, 15 de febrero de 2018
martes, 13 de febrero de 2018

lunes, 12 de febrero de 2018

domingo, 11 de febrero de 2018
Hortus Malabaricus (1678-1693)
.
Selected illustrations from the stunning Hortus Malabaricus (Garden of Malabar), an epic treatise dealing with the medicinal properties of the flora in the Indian state of Kerala.
.


http://publicdomainreview.org/collections/hortus-malabaricus-1678-1693/?utm_content=bufferd8d31&utm_medium=social&utm_source=facebook.com&utm_campaign=buffer
.
.

 .
.
 .
.
https://www.nature.com/articles/nature25447#f2
.
Genomics of the origin and evolution of Citrus
Guohong Albert Wu, Javier Terol, Victoria Ibanez, Antonio López-García, Estela Pérez-Román, Carles Borredá, Concha Domingo, Francisco R. Tadeo, Jose Carbonell-Caballero, Roberto Alonso, Franck Curk, Dongliang Du, Patrick Ollitrault, Mikeal L. Roose, Joaquin Dopazo, Frederick G. Gmitter, Daniel S. Rokhsar & Manuel Talon
Abstract
The genus Citrus,
comprising some of the most widely cultivated fruit crops worldwide,
includes an uncertain number of species. Here we describe ten natural
citrus species, using genomic, phylogenetic and biogeographic analyses
of 60 accessions representing diverse citrus germ plasms, and propose
that citrus diversified during the late Miocene epoch through a rapid
southeast Asian radiation that correlates with a marked weakening of the
monsoons. A second radiation enabled by migration across the Wallace
line gave rise to the Australian limes in the early Pliocene epoch.
Further identification and analyses of hybrids and admixed genomes
provides insights into the genealogy of major commercial cultivars of
citrus. Among mandarins and sweet orange, we find an extensive network
of relatedness that illuminates the domestication of these groups.
Widespread pummelo admixture among these mandarins and its correlation
with fruit size and acidity suggests a plausible role of pummelo
introgression in the selection of palatable mandarins. This work
provides a new evolutionary framework for the genus Citrus.
.
Figure 1. Genetic structure, heterozygosity and phylogeny of Citrus species. a, Principal coordinate analysis of 58 citrus accessions based on pairwise nuclear genome distances and metric multidimensional scaling. The first two axes separate the three main citrus groups (citrons, pummelos and mandarins) with interspecific hybrids (oranges, grapefruit, lemon and limes) situated at intermediate positions relative to their parental genotypes. b, Violin plots of the heterozygosity distribution in 58 citrus accessions, representing 10 taxonomic groups as well as 2 related genera, Poncirus (Poncirus trifoliata, also known as Citrus trifoliata) and Chinese box orange (Severinia). White dot, median; bar limits, upper and lower quartiles; whiskers, 1.5× interquartile range. The bimodal separation of intraspecies (light blue) and interspecies (light pink) genetic diversity is manifested among the admixed mandarins and across different genotypes including interspecific hybrids. Three-letter codes are listed in parenthesis with additional descriptions in Supplementary Table 2. c, Chronogram of citrus speciation. Two distinct and temporally well-separated phases of species radiation are apparent, with the southeast Asian citrus radiation followed by the Australian citrus diversification. Age calibration is based on the citrus fossil C. linczangensis16 from the Late Miocene (denoted by a filled red circle). The 95% confidence intervals are derived from 200 bootstraps. Bayesian posterior probability is 1.0 for all nodes. d, Proposed origin of citrus and ancient dispersal routes. Arrows suggest plausible migration directions of the ancestral citrus species from the centre of origin—the triangle formed by northeastern India, northern Myanmar and northwestern Yunnan. The proposal is compatible with citrus biogeography, phylogenetic relationships, the inferred timing of diversification and the paleogeography of the region, especially the geological history of Wallacea and Japan. The red star marks the fossil location of C. linczangensis. Citrus fruit images in c and d are not drawn to scale.
.
Figure 2: Admixture proportion and citrus genealogy. a, Allelic proportion of five progenitor citrus species in 50 accessions. CI, C. medica; FO, Fortunella; MA, C. reticulata; MC, C. micrantha; PU, C. maxima; UNK, unknown. The pummelos and citrons represent pure citrus species, whereas in the heterogeneous set of mandarins, the degree of pummelo introgression subdivides the group into pure (type-1) and admixed (type-2 and -3) mandarins. Three-letter code as in Fig. 1, see Supplementary Table 2 for details. b, Genealogy of major citrus genotypes. The five progenitor species are shown at the top. Blue lines represent simple crosses between two parental genotypes, whereas red lines represent more complex processes involving multiple individuals, generations and/or backcrosses. Whereas type-1 mandarins are pure species, type-2 (early-admixture) mandarins contain a small amount of pummelo admixture that can be traced back to a common pummelo ancestor (with P1 or P2 haplotypes). Later, additional pummelo introgressions into type-2 mandarins gave rise to both type-3 (late-admixture) mandarins and sweet orange. Further breeding between sweet orange and mandarins or within late-admixture mandarins produced additional modern mandarins. Fruit images are not to scale and represent the most popular citrus types. See Supplementary Note 1.1 for nomenclature usage.
.
.
Figure 3: Citrus relatedness network and haplotype sharing with sweet orange.a, Genetic relatedness among 48 citrus accessions derived from four progenitor species including citrons, pummelos, pure mandarins and micrantha. Solid lines connect pairs with coefficient of relatedness r > 0.45, with parent–child pairs denoted by arrows pointing from parent to child. Dashed and dotted lines correspond to 0.35
.https://www.nature.com/articles/nature25447#f2
.


sábado, 10 de febrero de 2018
.
The relative importance of plant intraspecific diversity in structuring arthropod communities: a meta-analysis
Julia Koricheva, Dexter Hayes
Abstract
1.Understanding how
plant diversity influences higher trophic levels is important for
predicting the consequences of global biodiversity loss. While early
studies have focused on the effects of plant species richness, more
recently a growing number of experiments have explored the effects of
plant intraspecific diversity by manipulating the genotypic richness of
plant communities.
2.By combining 162 estimates of effect size
from 60 experimental studies, we examined the effects of plant genotypic
richness on arthropods, one of the most diverse and abundant taxa which
play a crucial role in many ecosystem processes and services. We have
also compared the effects of plant genetic and species diversity on
arthropods when both were manipulated within the same study.
3.Species
richness and abundance of most trophic groups of arthropods was higher
in genetically diverse plant stands. Interestingly, the effects of plant
genetic diversity on natural enemies of herbivores were stronger than
the effects of plant genetic diversity on herbivores, suggesting that
plant genetic diversity effects on predators might be driven by
mechanisms independent of herbivores.
4.Herbivore and predator
abundance increased with plant genetic diversity in studies using wild
plants whereas predator abundance was unaffected and herbivore abundance
was reduced by crop genetic diversity. Damage by generalist herbivores
was reduced by plant genetic diversity whereas damage by specialist
herbivores was not affected.
5.When the effects of plant genetic
and species diversity on arthropods were compared within the same study,
the magnitude of plant genetic diversity effects was comparable to that
of plant species diversity.
6.Our results suggest that plant
genetic diversity has significant effects on the diversity of arthropods
across several trophic levels, thus highlighting the importance of
maintaining high levels of both plant species and genetic diversity for
arthropod conservation. However, the potential of using crop genetic
mixtures in agriculture for pest control appears to be limited as even
though herbivore abundance was reduced in genetically diverse plots,
herbivore damage and predator abundance were not affected by crop
genotypic richness.
 Figure 1. Effects of plant genetic diversity on different trophic groups of arthropods. Error bars represent 95% confidence intervals. Numbers next to error bars indicate number of studies in each category. Numbers in parentheses are Rosenberg’s fail-safe numbers which indicate how many additional studies with effect size of 0 and of the same weight as the average of those already being used would need to exist to reduce the significance of the mean effect to 0.05. Effects are considered significantly different from 0 if 95% confidence intervals do not cross 0 (dashed line).

.
.
viernes, 9 de febrero de 2018


martes, 6 de febrero de 2018
viernes, 2 de febrero de 2018
.
Atlas of Organics: Four maps of the world of organic agriculture
John Paull & Benjamin Hennig

World map of organic agriculture (equal map areas represent equal organic agriculture hectares).
.
 World map of organic wildculture (equal map areas represent equal organic wildculture hectares).
.
 World map of organic production hectares (equal map areas represent equal organic production hectares; organic production includes organic agriculture, wildculture, forestry and aquaculture).
.
 World map of organic producers (equal map areas represent equal numbers of organic producers).
https://www.academia.edu/25648267/Atlas_of_Organics_Four_maps_of_the_world_of_organic_agriculture
.
Atlas of Organics: Four maps of the world of organic agriculture
John Paull & Benjamin Hennig
The four maps in the present atlas of organic agriculture are visual presentations of current global organics data: (a) certified organic agriculture hectares; (b) certified organic wildculture hectares; (c) total certified organic production hectares (organic agriculture plus wildculture plus forestry plus aquaculture); (d) certified organic producers. Australia dominates in the world map of the organic agriculture hectares, Europe is strongly represented, and Africa is weakly represented. Finland dominates in the world organics map of organic wildculture, Zambia is a strong representative from Africa, and India is a strong representative from Asia. Australia dominates in the map of the organics world map of total organic production hectares (the aggregation of agriculture, wildculture, forestry, and aquaculture), followed by Finland. India dominates in the world organics map of organics producers. The maps illustrate the broad global diffusion of the organics meme, visually highlight leaders and laggers, and indicate opportunities for growth and better reportage. These maps are generated by the Worldmapper GIS algorithm developed at the University of Sheffield as a cartographic visualisation tool.
World map of organic agriculture (equal map areas represent equal organic agriculture hectares).
.

.

.

https://www.academia.edu/25648267/Atlas_of_Organics_Four_maps_of_the_world_of_organic_agriculture
.
Suscribirse a:
Entradas (Atom)